Create Bar Graph using absolute values
Introduction
We have already covered creating basic bar graphs here. We created the bar graph based on count of categorical levels, but if we want to create bar graph from absolute values i.e. we explicitly specify the height of the bar, then we will make use of the “stat” argument.
Procedure
We will be creating a custom dataframe which has the height of each bar. The dataframe looks as follows:
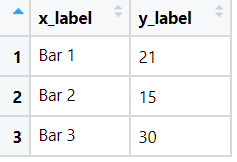
The y_label column we will be used as height for the bars.
To accomplish this, we use the stat=”identity” argument in geom_bar(…) function and specify the y axis data as y_label in the mapping=aes(.., y=y_label).
Code
library(ggplot2)
# specifying the absolute values in dataframe
absolute_dataframe <- data.frame("x_label" = c("Bar 1","Bar 2","Bar 3"), "y_label" = c(21,15,30))
# create absolute bar chart
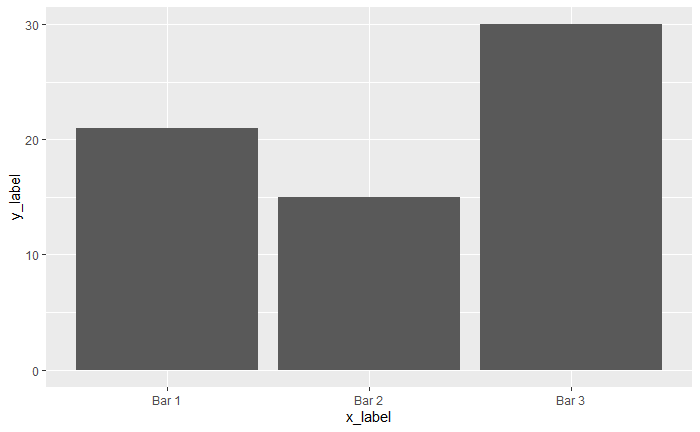
ggplot(data = absolute_dataframe) + geom_bar(mapping = aes(x = x_label, y=y_label), stat = "identity")And the output of above code is:
Conclusion
Thus we have successfully created bar chart with absolute values.
References
- https://r4ds.had.co.nz/