Create a basic Stacked Bar graph
Introduction
We have already covered creating basic bar graphs here and how to color a bar chart here.
If we want to create stacked bar chart we will make use of the fill=”<categorical variable>“ argument in aes.
Procedure
We will be working with the ggplot2::diamonds dataset, few rows of the data are:
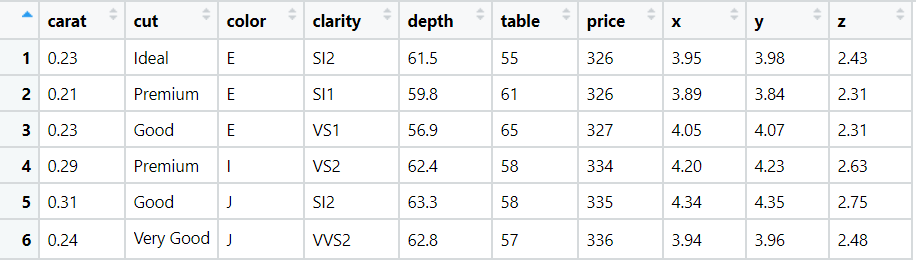
We will create bar graph which shows the count for each category of diamond cut and create stacks based on clarity of diamond.
Code
library(ggplot2)
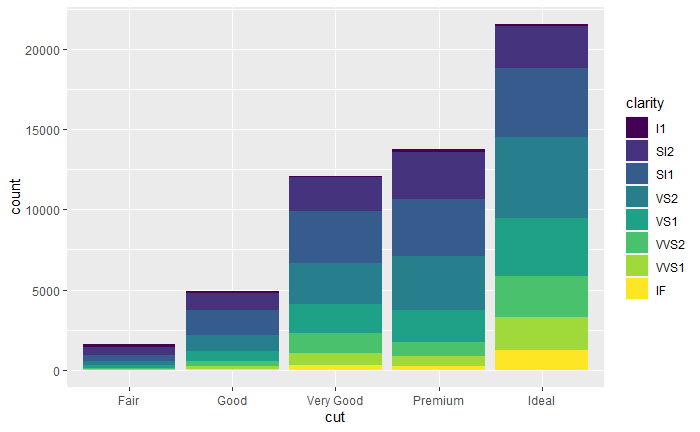
# stack based on clarity
ggplot(data = diamonds) + geom_bar(mapping = aes(x = cut, fill = clarity))And the output of above code is:
Conclusion
Thus we have successfully created basic stacked bar chart.
References
- https://r4ds.had.co.nz/