Create boxplot from multiple numerical columns
Introduction
We have looked at basic boxplot using categorical and continous variables here. If we had multiple numerical columns from which we want to create boxplot then we make use of the reshape2 package.
We will perform the following steps:
- create a unique identifier column
- pivot the columns into rows using melt(..) function from reshape2 package
- create boxplot
Procedure
We will be working with a custom dataframe.
# package for creating dataframe
library(tibble)

# 100 random numbers with mean = 100 and standard deviation = 50
seed <- rnorm(100, mean=100, sd=50)

df <- tibble(col1 = seed * 2.88,
             col2 = seed * 1.22,
             col3 = seed * 2.21)
View(df)
Few rows of the custom dataframe are:
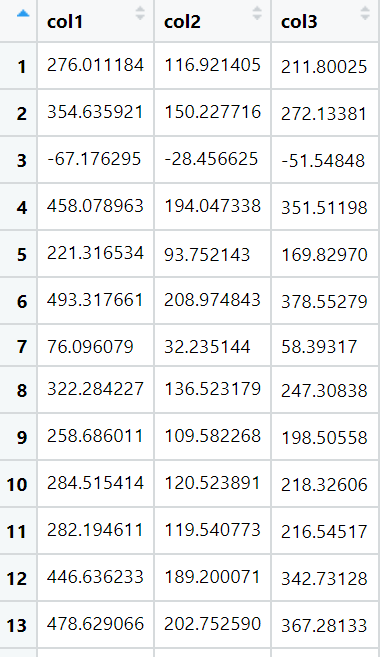
We want to create boxplot for col1, col2, and col3 to compare these continuous variables. We will first create a unique identifier which will be used during the pivot operation, perform pivot and then generate the boxplot.
Code
Step 1: Create unique identifier for pivot operation:
# refer procedure for definition of df
# create unique identifier
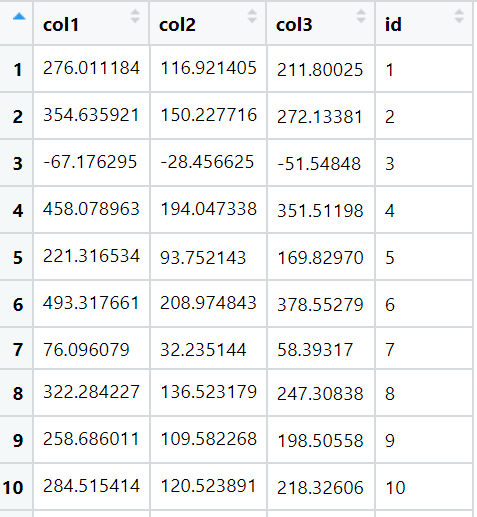
df$id <- seq(1:nrow(df))
View(df)The output of code is:
Step 2: We pivot the columns into rows using the melt(..) function and unique identifier
library(reshape2)

# pivot the columns col1, col2, col3 into rows
result <- reshape2::melt(df,
                         id.vars='id',
                         measure.vars=c('col1','col2','col3'))

View(result)
The output of code is:
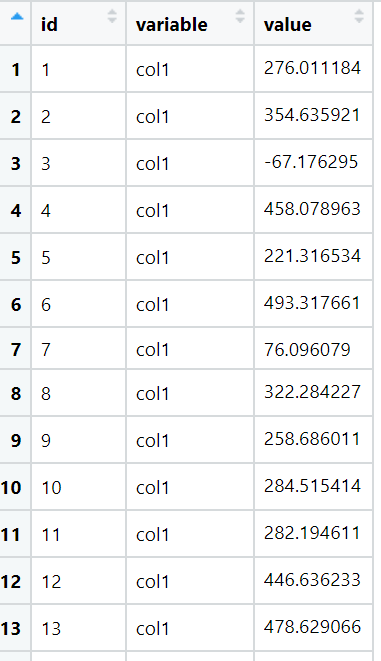
When the melt operation is performed, it returns dataframe with columns id, variable and value.
Step 3: Create boxplot
# refer step 2 for result
library(dplyr)
ggplot(result) + geom_boxplot(
aes(
x = variable,
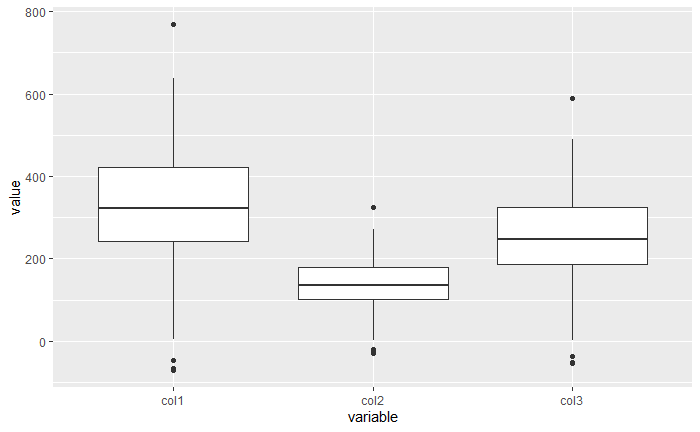
y = value))The output of code is:
Conclusion
Thus we have successfully created boxplot from multiple numerical columns.
References
- https://stackoverflow.com/questions/14785530/ggplot-boxplot-of-multiple-column-values