Create chart with multiple graphs overriding global data
Introduction
We have already covered how to create multiple graph charts by using global data here.
ggplot2 allows us to override the global data with local data for each geom function, which helps in customizing the charts further.
Procedure
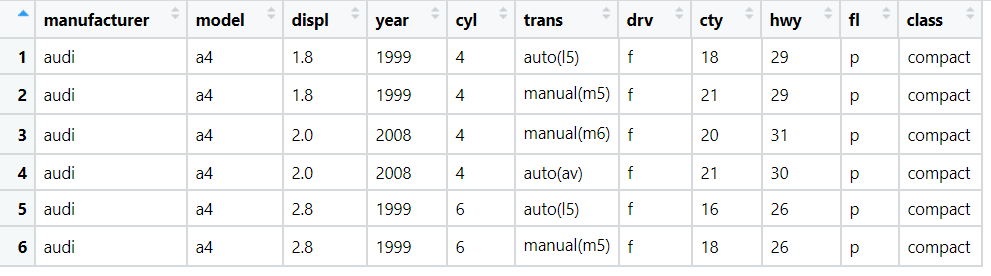
We will be working with the MPG data set present in-built in ggplot2. Few of the rows of the dataset are as follows:
We have already looked at creating a multiple graph chart using global data here.
We will be creating a subset of the original data and use that data to plot a line graph. The scatterplot is using the global data whereas the line graph uses the local data.
Code
library(ggplot2)
library(dplyr)

# create a subset of global data
local_data <- filter(mpg, class == "subcompact")

# overwrite global data with local data
ggplot(data = mpg, mapping = aes(x = displ, y = hwy)) + geom_point() + geom_smooth(data = local_data, se = FALSE )
And the output of above code is:
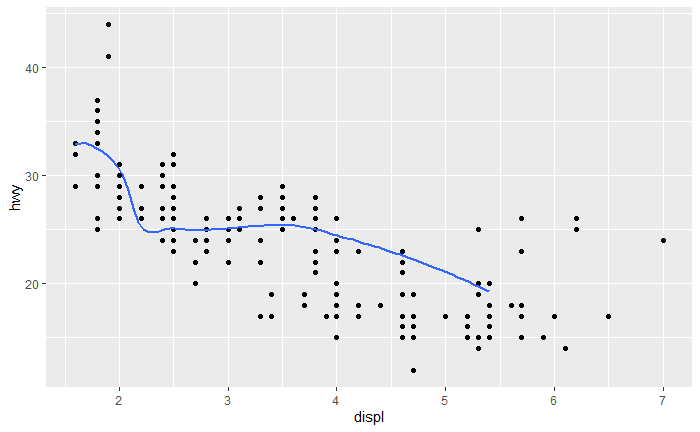
Conclusion
Thus we have successfully created chart with multiple graphs overriding global data.
References
- https://r4ds.had.co.nz/