Create basic Heatmap
Introduction
Heatmaps are generally used to compare categorical variable with another categorical variable. We create heatmap in ggplot2 using the geom_tile(..) function.
Procedure
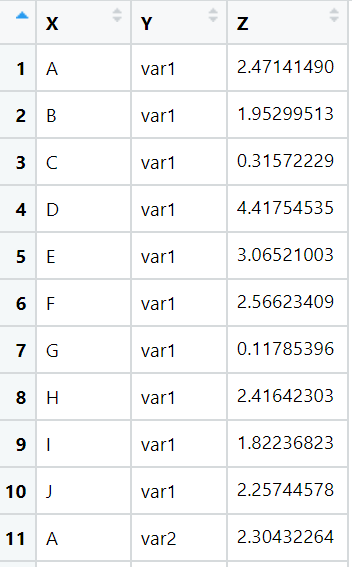
We will be working with a custom dataframe:
x <- LETTERS[1:10]
y <- paste0("var", seq(1,10))
df <- expand.grid(X=x, Y=y)
df$Z <- runif(100, 0, 5)

View(df)
Few rows in the custom dataframe are:
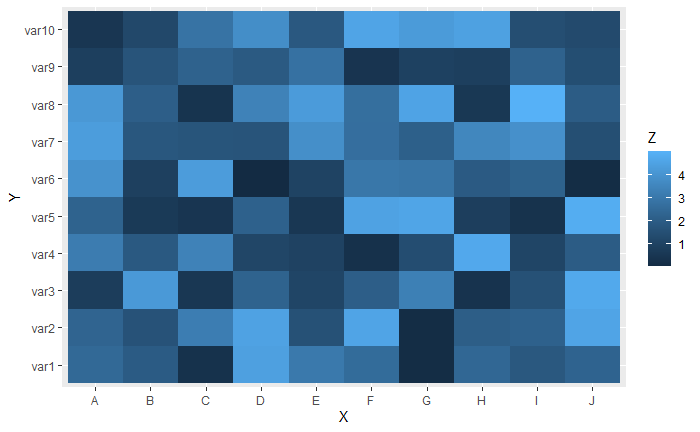
We will create heatmap to compare X categorical variable and Y categorical variable using the Z numerical variable.
Code
# refer procedure for definition of df
library(ggplot2)

# create heatmap
ggplot(df, aes(X, Y, fill= Z)) + geom_tile()
The output of code is:
Conclusion
Thus we have successfully created basic heatmap.
References
- https://www.r-graph-gallery.com/79-levelplot-with-ggplot2.html